When Covid-19 brought sports to a halt, brands and rights holders pivoted planned in-person activations to social media.
Even with fans returning to increasingly fuller stadiums, social and digital activations are still the number one priority for brands in sponsorship today, according to IEG. With more than 50 billion fan connections existing across the world of sport – think athletes, teams, leagues and brands – this should not come as a surprise. In some cases, more than 90 per cent of a brand’s earned sponsorship value can come from social sponsorship activation.
As for tracking the impact, there’s no other channel like social media when it comes to the power and depth of the data available. That is why Hookit is focused on tracking every professional athlete, team, league, event and venue across sports to measure the impact of their promotion of brands.
Hookit is the trusted standard in sponsorship technology by the world’s largest global brands. Supporting brands through every step of the sponsorship lifecycle, Hookit uses technology powered by artificial intelligence (AI) to analyse every post from the world of sports for brand promotion. More than 50 million pieces of content are analysed every month for text and visual promotion, extracting ten billion data points, including engagement (likes, comments, shares, and video views), the brands promoted, the promotion quality for each brand, and the sponsorship value for each brand within the post.
What data was included
For the 50 Most Marketable Brands ranking, all posts from professional athletes, teams, leagues, events and venues between 15th August 2020 and 15th August 2021 were examined for brand promotion. More than 30,000 sport rights holders and athletes posted during this period, promoting more than 8,000 brands.
Where the data comes from
Hookit has integrations with each of the major social media platforms, including:
- TikTok
- Twitch
- VK
- YouTube
What data gets brought in?
Hookit’s SportGraph tracks every major professional athlete and sports organisation, amounting to more than 500,000 accounts. Every post from these accounts gets pulled into Hookit’s database and analysed for brand content. If a brand logo is identified in the image, video, branded hashtag or channel handle, the computer vision software will identify and categorise that post as a branded post for the brand or brands included. Note that data is only brought in from public accounts in accordance with each platform’s data integration restrictions.
Getting to sponsorship value
At Hookit, sponsorship value begins with consumer (or fan) engagement. While this can happen through many channels, social and digital media provides the deepest dataset available to measure and calculate the impact of brand promotion through sports partners. We’re not asking fans what they think they like. We’re getting first-hand data on what they actually like and engage with.
To get to sponsorship value, we use a simple equation that brings in many factors related to brand promotion: potential value x promotion quality = sponsorship value. But let us break this down a bit.
Potential value or maximum ad value (MAV)
This metric is a product of social media engagement (likes, comments, shares and video views), as well as how much it would have cost a brand to reach that level of engagement through advertising cost per engagement (CPE) on that platform. We source actual executed rates from a third party based on what brands and agencies actually spent on social campaigns. The CPE rates vary by engagement type and platform. Multiplying engagement by the CPEs provides the upper limit of how much value a partner could have generated for a brand if every paid-for post achieved a perfect promotion.
Promotion quality (aka promo quality score)
Promotion quality is the discounting factor that scores how effectively partners promote your brand. Since partners have control over their content, promotion of your brand is not always perfect. Your logo could be small or blurry, sometimes other brands may also be promoted or there could be an overuse of hashtags and mentions, creating clutter. All of these factors are taken into account to score the quality of promotion on a zero to 100 per cent scale.
Sponsorship value or adjusted ad value (AAV)
As shown in the equation above, this ‘actual’ sponsorship value takes the potential value (MAV) and multiplies it by the promotion quality score to arrive at a discounted (AAV). Then, all branded posts by athletes and sports rights holders are aggregated to get a cumulative value for sponsorship for each brand tracked.
Notes about the rankings
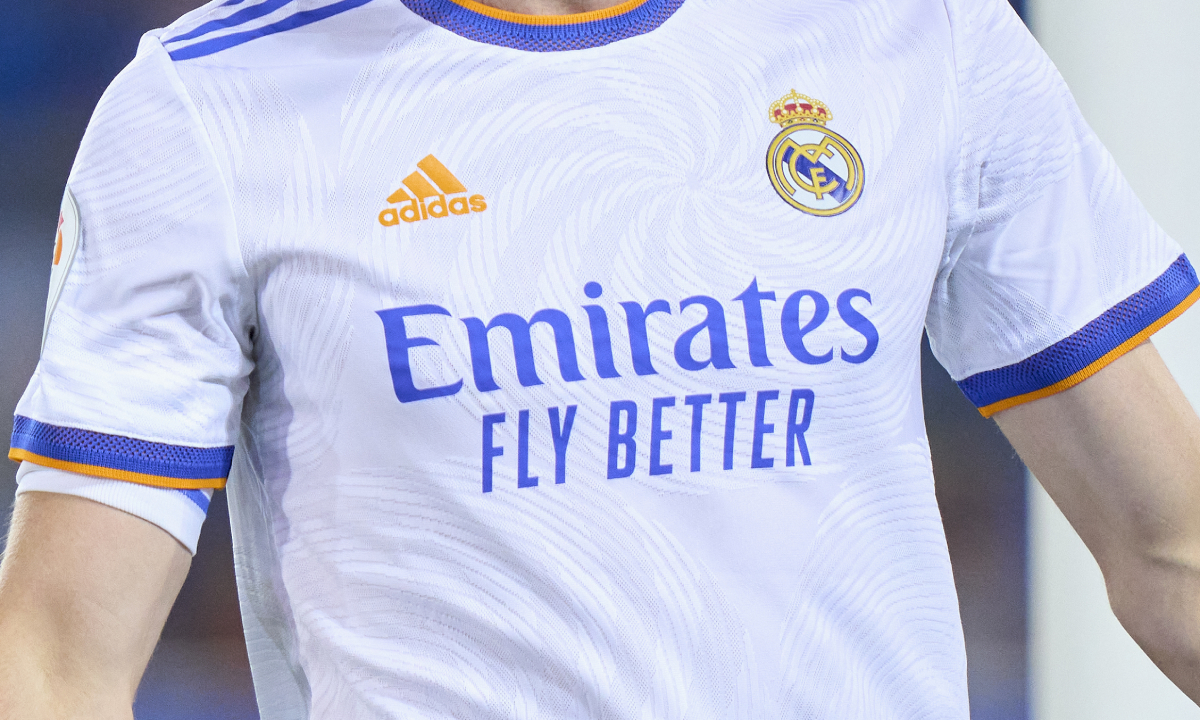
From last year’s list 36 brands have retained their place in the 2021 50 Most Marketable Brands, meaning that nearly 30 per cent of the top brands fell out of the rankings this year. The top three – Nike, Adidas and Emirates – are still the top three, although Adidas has jumped ahead of the airline in this year’s ranking.
Part of the reason for the high change rate from 2020 is that promotion from events and venues is included in this year’s rankings, whereas it was not in 2020. The reason for that is that half of the date range in 2020 included limited to no events due to Covid. So, in an attempt to keep a consistent data set, those were excluded.
Speaking of events, 2021 has seen the Olympics and Uefa European Championship, among other key events, driving significant value for brands. The top 50 brands in 2021 earned US$4.5billion in sponsorship value, 50 per cent more than the total for the top 50 brands in 2020.
Nearly all of these top 50 brands are big spenders in sport, spending tens or even hundreds of millions of dollars on partnerships. This spend is not factored into the rankings, meaning brands that spend more are more likely to rise to the top, as brands that have a bigger spend are more likely to have a greater number of promotion partners or partners with more fans and thus more fan engagement – a key factor in generating sponsorship value. Keep this scale factor in mind as you scan through the list. Smaller brands can have extraordinarily effective partnerships with high ROI or ROO, but not make the top 50 simply due to the scale of sponsorships that these top 50 brands are able to afford.
Related to spend, it should be noted that the data for the number of promoters does not directly reflect the total number of partnerships that a brand has. For example, Nike is ranked number one and has more than 16,000 athletes and sports rights holders promoting as partners. This includes deliberate as well as incidental promotion. Incidental promotion occurs when only a logo is visible in a post that isn’t meant to be a branded post. For example, the Nike logo shows up on every jersey in the National Basketball Association (NBA) and National Football League (NFL), as well as dozens of global high-profile soccer teams. Any time the team or a player posts a picture of themselves in their kit, Nike gets sponsorship value due to the Swoosh on the shirt. This value even comes from posts by athletes sponsored by other apparel brands like Adidas or Puma.
Key trends and insights from the 2021 SportsPro 50 Most Marketable Brands:
- Every one of the top 50 brands gets a significant portion of their value from one or more of these four core sports: soccer, motorsport, basketball and cricket.
- Similar to 2020, the top 50 brands received nearly 50 per cent of the total sponsorship value generated for all brands across sport during this time period.
- The automotive industry again dominated the list with 13 brands, up from 12 in 2020. The financial sector also added one brand, up to eight in total in 2021. The beverage industry sat alongside apparel and accessories as the sectors with the next most brands, but lost two and four brands out of the top 50 from last year, respectively.
- Apparel and accessories brands received the most total value of all industries, at more than US$1.6 billion, but saw their number halved as only Nike, Adidas, Puma, and Rolex retained their spots in the top 50.
- The top three brand partnerships by total sponsorship AAV generated were all leagues promoting an official sponsor (such as La Liga promoting Santander).
If you’re interested in learning more about why these brands are ranked in this order, which partners contributed most to these rankings, or where your organisation ranks, reach out to us at insights@hookit.com.